
OBIEE 11.1.1.9 – The New Features of the front-end
Rittman Mead Consulting published this month a post where it describe the new front-end features of OBIEE 11.1.1.9 for Developers and Business Users. Let’s give a look:
Search & Sort options inside the Subject Area
There is a new option to search inside the subject area when we create an analysis. If we press the magnifying glass icon in the Subject Areas pane, a search box appears and OBIEE will return all the objects that contains the text that we entered. We can also use the % wildcard.

In addition there is also the option to order the objects inside the subject area sorting the folders and the presentation columns inside them. The default value is showing the objects in the way that are saved in the repository.

Save Calculated Items in the Web Catalog
A very useful feature for business users is the possibility to create calculated items in an analysis and save it in the catalog in order to reuse it in other analyses for the same subject area.
In the Results tab there is a new icon for creating a new measure. The calculation is created in the same way the column formulas are created.

After the new measure is created you can go to the Criteria tab and in the column pop-up menu select the Save Column As option. In this manner you save this new measure as a new object in the catalog to be reused in other analyses. The feature of creating a new calculated measure for tables and pivot tables was included in the 11.1.1.7.10 version but the possibility to save the column in the catalog is a new feature of the OBIEE 11.1.1.9.


You can also change the properties of the new column in the Criteria tab but be aware that conditional formatting and conditional action links for the column are not saved to the catalog. Regular action links are saved for the column as well as the format properties.
The saved column can be edited from the catalog pane and catalog page. All the changes that you make in the catalog are applied to every analysis that used this column. If you modify it inside a particular analysis, these changes are valid only for the analysis that you are working on.

To be able to save new measures as columns you should have the Save Column privilege.

Global Variables
In this version we find a new new type of variables: the Global Variables. Global Variables can be defined in the context of an analysis and can be used in other analysis. Useful to do some intermediate reusable calculations.
To create a new global variable, select the Edit Formula option for the required column. When you press the Variable button in the Formula Editor you will see the new Global option. The Insert Global Variable dialog appears and you can select an existing global variable to be used in the formula, or you can create a new one. To create a new one you need to enter a name, type and value. If you want to use an expression like in the example (Min(Revenue)) as value, the data type should be Text.

To reference a global variable you need to use the fully qualified name including the context: @{global.variables.variablename}.

Also to manage global variables you should have the Manage Global Variables privilege.
New Visualisation: Treemap
There is a new visualisation called Treemap since OBIEE 11.1.1.7.10. Treemap groups the dimensional data that you selected in the analysis in tiles. By default, the tiles size is based in the content of first measure of the analysis and the tiles colour is based in the content of the second measure. If you have only one measure in your analysis, is used for both size and colour.

You can edit it as any other view and change the group by information as well as the measures which affects the size and colour of the tile and the range of colours that you want to use. Also you can choose the style between seeing the information in coloured bins or using continuous colour fill. If you selected the first one you can also select the amount of different coloured bins do you want to use.

New Preview Styles
When you want to preview an analysis in the Results tab, instead of showing immediately how the analysis will look, OBIEE offers you different Styles to see your analysis. These feature was also included since the 11.1.1.7.10 version. In case you want to create a custom style, Oracle recommends to use the new Skyros style as a starting point.

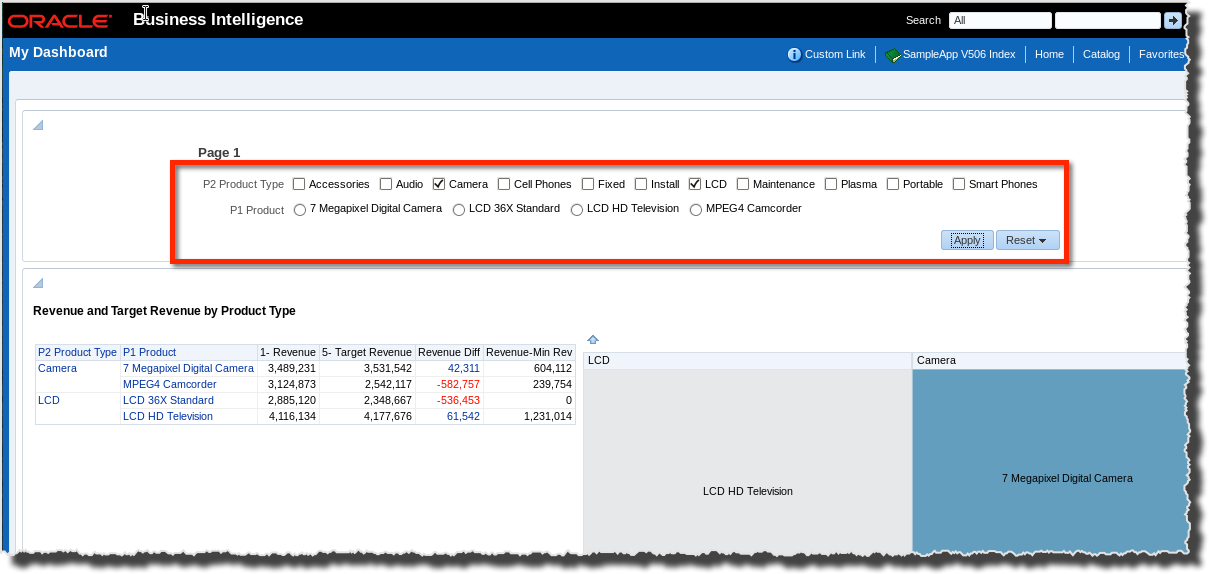
Horizontal Layout for Radio Button and Check Box Dashboard Prompts
Radio button and check box dashboards prompts can be showed horizontally. When you create a new dashboard prompt using check box or radio button under Options, you can select between horizontal or Vertical Layout appears under Options.


Enhancements in Export & Print Options
In this version, you will find more options in the Print and Export Options dialog. You can select if you want to include charts, images and formatting or to specify column properties like the column width and to wrap the text in columns.

In summary, these features are simple but quite useful for business users and front-end developers, and give more flexibility to create better data visualisations.
